You love the blog, so subscribe to the Beervana Podcast on iTunes or Soundcloud today!

Showing posts with label stats. Show all posts

Wednesday, September 07, 2016

The "Craft Slowdown" is a Fiction

The beer market is changing. For years, the craft segment has been all growth, from the tiniest nano to the category leaders (including gray-market craft like Blue Moon and Shock Top). For the first time in a lot of years, that's no longer true. The Brewers Association recently reported that the craft segment had slowed to just 8% growth (which is still crazy good, though it's lower than at any time since 2009), but here's the thing: the biggest brands are not only not growing, they're in decline:
"[C]ombined volumes for the top 12 craft brewers grew only 1% for the three months to May," Sanford C. Bernstein stated this week citing Nielsen figures in a report titled "The Dramatic Slowdown of Craft Beer Continues." The slowdown appears to be coming from the biggest craft brands.
I recently took a gander at the OLCC's numbers* for Oregon sales, and the story is the same. The state's leading seller, Deschutes, is down 16% over the first half of the year, and the third-largest, Ninkasi, is down 10%. (The OLCC no longer captures figures for Widmer Brothers, another top-seller.) What's going on, says the Brewers Association's Bart Watson, is that the “long tail of craft continues to smoke; there's very little evidence of much of a slowdown there.” The implication is that the big brands are suffering at the hands of smaller competitors.

source
This "long tail" he's describing refers to the thousands of small breweries that produce tiny volumes. (In your mind's eye, imagine a graph with brewery volumes on one axis and percent of the market on the other; a few breweries make most of the beer, and a whole lot of breweries--the tail--make marginal amounts.) There's no doubt these breweries have room to grow--it's relatively easy to build ten percent growth onto a base of 500 barrels, and some of those breweries will be growing much faster.

But here's the thing: little breweries just don't constitute much of the volume. Even when you confine your view to the breweries represented by the Brewers Association, the numbers are pretty staggering: 90% of American craft breweries make 5,000 barrels or less of beer a year, and they account for just 12% of the beer tracked by Brewers Association. The top 1.6% of breweries in this group make over two-thirds of the beer. In other words, that long tail could quadruple its production and still only constitute a third of all the beer made. That long tail is never going to account for a sizable share of the volume.

What's actually happening has to do with the breweries that the Brewers Association doesn't track--those recently purchased by ABI, MillerCoors, Constellation, and Heineken--which are growing, and incredibly fast. With Bud's might, Goose Island IPA has become one of the best-sellers in that style. Before selling to ABI, Elysian only had the available hops to brew Space Dust once a week. With ABI's access, hops are no longer a limitation, and the brand has grown 2000%. When I glanced at those Oregon numbers, I was shocked to see the movement of the number-two brewery on the list, ABI's 10 Barrel. In the first half of 2015, it sold a bit less than 13,000 barrels in Oregon. In the first half of 2016, it sold 23,000--an 81% jump.

At the top end, where volumes are measured in millions of barrels, the competition is getting extremely tight. Breweries like Sierra Nevada and Boston Beer are competing against brands that have enormous advantages they can't match:
Using ABI's distribution network, its craft brands now dominate shelf space and tap handles across the nation. Not only that, but the beer is often priced lower than other similar but independently owned craft beers. That has led to accusations that ABI is intentionally undercutting competition: Goose Island kegs, which were once $110, can sometimes be found for $56, and six-packs dip well under 10 bucks, even in major cities. If price is all that matters to drinkers, there's simply no way a smaller, independent brewery can compete.
The "slowdown" in "craft" is a fiction. What's happening is that the top end of the market has gotten competitive, and big companies can afford a price war to build volume. Mid-sized independents can't compete at those prices, and are losing a few customers to cheaper brands like Goose. Some enterprising data journalist will at some point create a database that includes all the brands that fall into the craft category and look at the aggregate growth. I'd bet my bottom dollar it shows that the growth curve is still well above 10%.
_________________
*The OLCC's figures have grown increasingly suspect, but are probably at least accurate enough to assess the direction of trends.

Wednesday, June 29, 2016

How Big Will Craft Get? Oregon's Numbers are Suggestive

The Oregon Brewers Guild released the latest juicy batch of beer consumption and brewery statistics for the state, and it is as ever quite fascinating. Let's start with a few of the topline numbers and then jump into some thinking about what they mean.
  • 22% of the beer consumed in Oregon was brewed here--and with the exception of 10 Barrel, these all conform to the general sense of "craft breweries."
  • 63% of draft beer sold in Oregon is brewed in Oregon. (63%!)
  • The amount of Oregon-brewed beer consumed in Oregon increased 11% in the past year, even while...
  • The amount of beer brewed in Oregon increased only 3.5%.
  • Oregon had 206 brewing companies operating 246 brewing facilities in 72 cities at the end of the year.
  • Portland has 65 breweries and there are 95 in the metro area.
Lets break all this down a bit. The Oregon Brewers Guild is not concerned with craft beer, it's concerned with Oregon's breweries. As such it does not try to gather stats for "craft beer," which would include some portion of imported beer and craft beer made in other states. To make the Guild's stats consistent with the Brewers Associations', you'd include craft beer brewed in other states. Let's be extremely cautious and bump the "craft" share of the Oregon market up from 22% to 25% then. How does that compare with national stats? Oregon's market is twice as large: nationally, only 12.8% of beer sold is "craft."  The US market for beer is roughly 200 million barrels and if the country drank beer at Oregon's rate, that would put it at 50 million barrels.  


That's good, but the stats that most interested me were these: Oregon's consumption of craft beer--already the highest in the nation--continued to grow at an 11% clip. But its production only grew at about a third as fast, at 3.5%. Most of Oregon's beer production comes from just a handful of breweries--breweries that sell regionally or nationally. While breweries like Deschutes, Craft Brewers Alliance, Full Sail, and Ninkasi sell a lot of beer locally, they sell way more of it out of state. We can take this to mean that they're having a harder time selling their beer in growing markets outside Oregon.

I think we're seeing this reflected in recent stories about slowing sales for the big flagship brands even as the craft segment continues to grow. The craft segment is changing and becoming more local even as many big brands are expanding and trying to grab a piece of that ever-expanding pie.

I used to think Oregon was a cultural anomaly and that our progress in developing beer culture would not be replicated elsewhere. But I started thinking that when craft brewing had a 4% market share and Oregon was at 12%. Oregon is likely always going to be one of the national leaders in craft beer consumption and production, but it isn't anomalous--it's just ahead of the curve. And it's growing. What proportion of the national beer market will the craft segment on day occupy? At least 25%, I'd guess--and possibly well north of that.

Wednesday, March 09, 2016

What Oregonians Drank in 2015

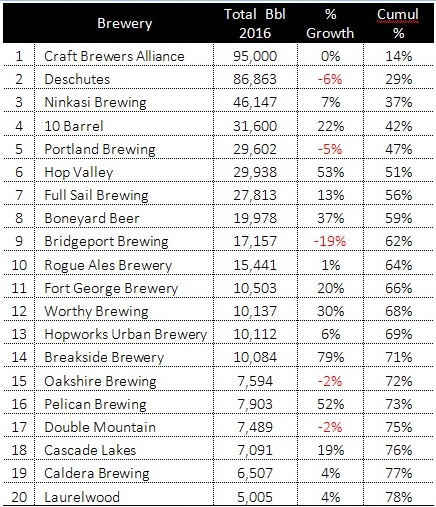
Each year, General Distribution's Jim Fick closely tracks the sales of Oregon beer in Oregon, and he very graciously forwards me the spreadsheet with the numbers. The final figures are out for 2015, so we can look at which breweries were selling the most beer here in their home state. (Important note: these figures come from the OLCC and track just the barrels of beer sold in Oregon by Oregon breweries; they do not track total barrels sold by each brewery nor the amount of beer sold here by non-Oregon brewers.)

I'm going to festoon these numbers with a lot of caveats and explanations in a moment, but I wanted to point out one important figure first before we drill down. In 2015, adult Oregonians drank an average of 6.4 gallons of locally brewed beer. That's a per-capita rate, and includes all non-beer drinkers--every Oregonian 21 and older.  That's just beer brewed here. Since Oregon no longer has any industrial plants producing mass market lagers, 100% of that local beer falls into the "craft" segment. If the rest of country consumed beer like Oregon, the craft segment would be 48 million barrels--and it's currently just at 21 million. But even that understates things, because these numbers don't capture the craft-segment beer we drink from other states. If the rest of the country consumed craft beer like Oregon, the craft segment would currently constitute somewhere between a quarter and a third of the entire market. There's not a single reason in the world I can think of why this is not the future of beer.

And that's why companies are paying a billion dollars for 150,000-barrel breweries.

But now onto the numbers. I'm not going to go into enormous detail here, because the system the OLCC--the agency that tracks beer sales in Oregon--uses to track sales began to fray badly in 2015. For some reason, sales of the fourth-largest Oregon brewery just vanished from the list in October. The Craft Brewers Association Alliance moved their storage warehouse offsite in the fall, and that somehow caused the OLCC to stop tracking their numbers. Folks at CBA gave me a rough update on their figures, and I calculated 10 Barrel's sales based on the existing year-to-date figures that went through September to come up with these numbers. Also, the beer for Laurelwood's six-packs is brewed in Washington state and isn't reflected in these numbers.

One final comment. Although CBA appears at the top of this list, Deschutes is really still Oregon's best-selling brewery. CBA's numbers include sales of Kona, Widmer Brothers, and Redhook; listed separately, they'd fall somewhere behind Bend's big dog. Here's the top twenty.


A few comments and notes. The big gainers and decliners are pretty obvious. Gains among the top twenty breweries far exceed losses; these breweries made 30,363 more barrels in 2015 than they did in 2014. The far right column reflects the cumulative percentage of all the beer sold. So, for example, the top six breweries sold half of all the Oregon-brewed beer in Oregon; the top 12 brewed two-thirds, and so on. These may seem like lopsided numbers, but they're actually declining a bit. Growth among the top five was just 2,183 barrels--an growth of 1%. Overall, the entire market grew an estimated 56,000 barrels, from 565,472 to 621,328

As the president would say (sort of): the state of beer in Oregon is strong.

Friday, January 08, 2016

A Long-Winded Way of Saying: Quit Counting Breweries

On Tuesday, in one of my least-viral posts in recent history, I pointed out that assessing countries based only on the growth in number of new breweries gives you a limited perspective. It's better if you also consider existing breweries and total beer production. Germany produces a ton of beer and still managed to support 1,300+ breweries, so despite its anemic new-brewery growth, you still have to acknowledge its preeminence among brewing countries. Owing to the wild success of that post, I'm back for more.

Now we turn to the US for a similar look at state-by-state numbers. These figures come from a paper in The Journal of Wine Economics from a couple months past. They were working with 2012 numbers, but they still paint a very rich portrait. Here are the brewery counts from that year for the top ten states (they look woefully out-of-date, but probably line up pretty closely with the current top ten and demonstrate a similar distribution).


But now have a look at the top ten states by production (this is craft brewery production only). It paints quite a different picture.


California had nearly three times as many breweries as Pennsylvania in 2012, but actually brewed less beer. (Also not that  theMassachusetts number is misleading. It comes principally from Sam Adams, but of course, the amount of Sam Adams brewed in Mass is a tiny trickle--the state's production is actually south of 500,000 barrels.) Washington made less than a tenth the amount of beer as Pennsylvania. It would be great to run this with 2015 numbers, because the effect would be far more dramatic. Nearly all of the breweries that have opened since 2012 are brewing a tiny fraction of the beer. So all the talk of new brewery openings and total breweries would obscure that fact that two states brew a huge share of all the craft beer in the US, and the top four are far ahead of the rest of the country.

And the effect can get very pronounced the further you go down the list. Illinois, for example, had 59 breweries in 2012, but collectively only brewed 81,000 barrels--less than many larger craft breweries. (North Carolinians, who do a lot of bragging about the number of breweries they have, should probably be a bit more circumspect; in 2012 their 59 breweries only made 156,000 barrels--about a tenth the amount of Oregon.)

If you think I'm on a weird bender about possibly extraneous measures, well ... there's more! Over at All About Beer, I try to make the case that brewery numbers are themselves not terribly reliable. (Barrel numbers, which are tracked by the tax man, are rock-solid.)
If you’re like me, you suspect there’s an actual number of breweries in these locations, one that is knowable and countable, and if everyone adhered to the same rules, we could tot them up officially. We know quarks exist, for god’s sake; surely the number of breweries in London, England can’t be beyond our ken. It kind of is. Here we drop into something like a quantum state, where arithmetic may no longer suffice. There exist what we might call Schrödinger breweries, entities that can simultaneously be said to exist and not. I’ll describe the difficulty by way of example.
All of which is to say that counting breweries doesn't make a lot of sense. Cities and states do not try to burnish their cred by citing stats on the number of restaurants or karaoke bars or pet stores. What we actually care about are important, excellent, interesting, or unusual breweries, right? I propose that we quit harping on total numbers.


Update. In the manner of blogs, this post sort of developed as I was writing it. (Note to self: don't do that.) Let me clarify the actual point by responding to Stan Hieronymus' comment:
"Right now there are four breweries within 3 miles of our house (in St. Louis). If plans for 2 more go through, likely, then there will be 6 breweries. At a personal level, the number matters. And shouldn't beer always be personal? Put another way, the big picture that interests me is a sum of all the little pictures." 
Yes, exactly. My real belief is that there is way to much focus on the number of breweries to the exclusion of other factors. Production is a proxy for popularity at both the market and brewery level. They suggest a market where a lot of people are drinking a lot of beer. Illinois looks like a good beer state until you consider that people weren't drinking the beer. In Stan's example, it's great to have a lot of breweries near your house if they're good breweries. Having a bunch of mediocre breweries is no bonus at all. By only focusing on numbers, we miss other important factors. It should be a consideration, but it should never be the only consideration.

Tuesday, January 05, 2016

New Brewery Numbers Do Not Tell the Whole Story

Ron Pattinson has a nice post today that looks at the growth in European breweries by country in the five years between 2009-2014. What jumped out to him was the tiny growth (2%) in the number of breweries in Germany. He ran, Pattinson-style, a table with raw numbers. Allow me to render that statistic visually (click to enlarge):


It's true that the growth of 2% lags the rest of Europe. But percentages can sometimes be a little deceiving. The 21 breweries Germany added weren't that far behind the 24 Ireland added--but that was good enough for 92% growth on the Emerald Isle.* So what if we instead look at total breweries? How does Germany fare then? Quite a lot better, as you'd expect.


That brings me to my final visualization--and probably the most illuminating. We often look at brewery counts as a valuable metric for ... something. (I do it too, and I don't know why it's so compelling). But what if we look at the actual amount of beer a country produces rather than the number of breweries? Does that shed light on matters? It does.


(There is one final number crunch I could have shown, but it's not dramatic; it compares the production to population, but the differences weren't large. Italy was a bit of an outlier on the low side and the Czech Republic on the high side, but most were within close range of each other.)

The moral of the story is this: new brewery numbers are not a good measure of the entire health of a local beer market. You have to look at the total number of breweries and total production of those breweries. No single number tells a complete enough story on its own--you really need to look at all of them together. All countries went through massive consolidation in the 20th century, but Germany less so. It stands to reason that Germany would be repopulating its breweries more slowly now. (Which is not to say that Ron's initial observation isn't interesting--it is. And many would love to see more rapid growth of young, adventuresome breweries in Germany.)

_______________
*As commenters on Ron's post noted, those numbers are probably not quite accurate. It turns out counting breweries is a real challenge for existential and semantic reasons. More on that in due course.

Tuesday, December 09, 2014

We Like IPA and Other Findings

In the past couple years, the Brewers Association (BA) has really stepped up their stats game, a development I heartily welcome.  Today comes a quickie update on the year in beer, and three data points are worth closer scrutiny.

We Like IPAs
Sez the BA: "According to retail scan data, IPA is up 47 percent by volume and 49 percent by dollar sales, accounting for 21 percent volume share of craft."

One in every five beers we drink is some version of an IPA--and there's a good reason to believe this understates matters.  The BA relies on supermarket scans for these data (Symphony IRI and Nielsen), so they're not seeing what people drink in pubs or what they buy from specialty stores.  The figure is probably closer to a quarter of the craft beer sold rather than a fifth.

More interestingly, keep in mind that this is a new trend.  It was only three years ago that IPAs finally eclipsed long-time leader pale ale.  The ascendance of IPA is still an incipient trend, and who knows where it will finally level off.

A Lot of Breweries
BA: Breweries are opening at a rate of 1.5 per day. In addition, there are more than 2,000 breweries in planning....  In November, the United States passed the mark of 3,200 brewers in the country."

I continue to believe that, on the whole, the craft beer segment is positioned for strong growth over the coming decade.  But holy moly, that is one king-hell lot of breweries.  I suspect that there's more than a few poor business plans among them.  I wouldn't be surprised to see brewery closings start to spike soon.

Women Will Save Us
BA: "Additionally, women consume almost 32 percent of craft beer volume, almost half of which comes from women ages 21-34."

This is one of the reasons I've long been so bullish on craft beer in the US.  Despite occasional transgressions, craft breweries have been really good about offering a gender-neutral product.  They have neither alienated women with idiotic babes-in-bikinis ads nor condescended to them with idiotic products.  They've just made good beer and assumed women would like it.  Not-so-magically, that's what's happening.

Friday, September 16, 2011

Sales of Craft Exceed Domestic Premium in the Pac NW

Last week, I began what will be a short series of posts on a presentation Dan Wandel made for SymphonyIRI that looked at sales figures and trends for craft beer sold at supermarkets (post 1, post 2). Today I'm going to highlight the last slide Dan showed us. It's a graph of two segments of the beer market, domestic premium and craft beer. It was a complex chart going back 2 1/2 years and split between Oregon and Washington. I've reproduced a detail of the slide showing the past year's sales in Oregon. Washington's looks roughly the same.


In April 2010, craft beer briefly outsold domestic premiums, then fell behind again. But in October, craft passed domestic premium again and hasn't looked back. It's worth adding a bit more context to fully understand these numbers. Keep in mind that Symphony/IRI only tracks supermarkets, not specialty retailers like Whole Foods and New Seasons--where craft beer massively outsells domestic premium. It also doesn't capture draft sales. In other words, the company tracks sales in the place most favorable to the domestic premiums like Bud and Coors.

The other thing to acknowledge is that the NW is way out in front of everyone. The point in preparing the slides is to illustrate craft beer's potential nationally based on their actual numbers here. We tend to think that craft beer will never supplant national light lagers, but these figures show they can.

One final point. In his presentation, Wandel sometimes included A-B's Shock Top and Coors' Blue Moon in the craft segment and sometimes he didn't. But no matter what segment you put them in, it's worth noting that they sell more than any single craft brand. (At the blogger's conference, I asked Blue Moon's Lisa Zimmer how many barrels that brand sold, and I think she said 1.7 million. That's about 10% the size of the entire craft market.)

Some people get freaked by the idea that the macros are co-opting craft beer, and to a certain extent, so am I. The silver lining, though, is that craft is now the tail that's wagging the dog. Macros see charts like the one in this post, and they see the writing on the wall: Americans are increasingly rejecting light lagers. People have been looking at SymphonyIRI's numbers on macros and seeing staggering five-year declines in domestic sales: Budweiser -30%, Miller Genuine Draft -51%, Old Milwaukee -52%, Michelob -72%. The trends are unmistakable: light lagers, though still the dominant player in beer, will continue an inexorable decline in the years ahead, replaced by more flavorful ales. Just look at what's happening in the Northwest.

_________________
CHART: SYMPHONY/IRI

Tuesday, September 13, 2011

Best-Selling American Craft Beers

Last week, I began what will be a short series of posts on a presentation Dan Wandel made for SymphonyIRI that looked at sales figures and trends for craft beer sold at supermarkets. In that post we looked at the best-selling styles; today we look at best-selling brands.

As with last week, I've reworked the data a bit to take out some of the best-selling SKUs tracked by SymphonyIRI: Sam Adams Seasonal (No. 3), Sam Adams Variety Pack (No. 5), Sierra Nevada Seasonal (No. 9) and New Belgium Seasonal (No. 12). (In the case of seasonals, several beers share the same SKU and are sold at different times of the year; variety packs, obviously, include more than one beer.) The remaining eleven account for 28.5% of all the beer tracked by SymphonyIRI--a sizable piece of the pie given that the company tracks 253 IPAs alone. In fact, the top four account for nearly 20% of all sales.

Here are the top ten, and the percentages indicate the total proportion of the entire craft segment that beer controls. The eleventh beer is Magic Hat's Number 9, at 1%.


When I looked at this list, my eye was attracted to Sierra Nevada's Torpedo--and then I realized something about this list. Only Torpedo is a recent brand. In fact, the next newest beer is Sam Adams Light, released a decade ago.
Sierra Nevada Pale (1980)
Sam Adams Boston Lager (1984)
New Belgium Fat Tire (1991)
Shiner Bock (1913)
Widmer Hefeweizen (1985)
Sierra Nevada Torpedo (2009, bottle)
Sam Adams Light (2001)
Redhook IPA (1995)
Kona Longboard Lager (1998)
Deschutes Mirror Pond (1992ish)

Clearly, it helps to have a jump on things. To see just how consistent these beers have been, have a look at Stan Hieronymus' report from four years back. And yet, despite this consistency, it's not like there's no movement. Not all these beers are headed in the same direction or at the same rate. (And no, I have no idea if these reflect year-to-year variation or are indicative of larger trends or volatility.)
Sierra Nevada Pale_______0.9%
Sam Adams Boston Lager___0.0%
New Belgium Fat Tire____-4.5%
Shiner Bock_____++++++__11.1%
Widmer Hefeweizen_______-9.5%
Sierra Nevada Torpedo___59.2%
Sam Adams Light________-15.1%
Redhook IPA______________4.5%
Kona Longboard Lager____45.5%
Deschutes Mirror Pond____3.5%
In some ways, it's easy to overthink these stats, though. Deschutes is the fifth largest craft brewery, but only cracks the list at number ten. What does this tell us? That Deschutes' production includes a pretty diverse line of beers that sell well. Is that good or bad? Probably neither, but interesting. By contrast, New Belgium has a huge tent pole beer in Fat Tire.

More to come.